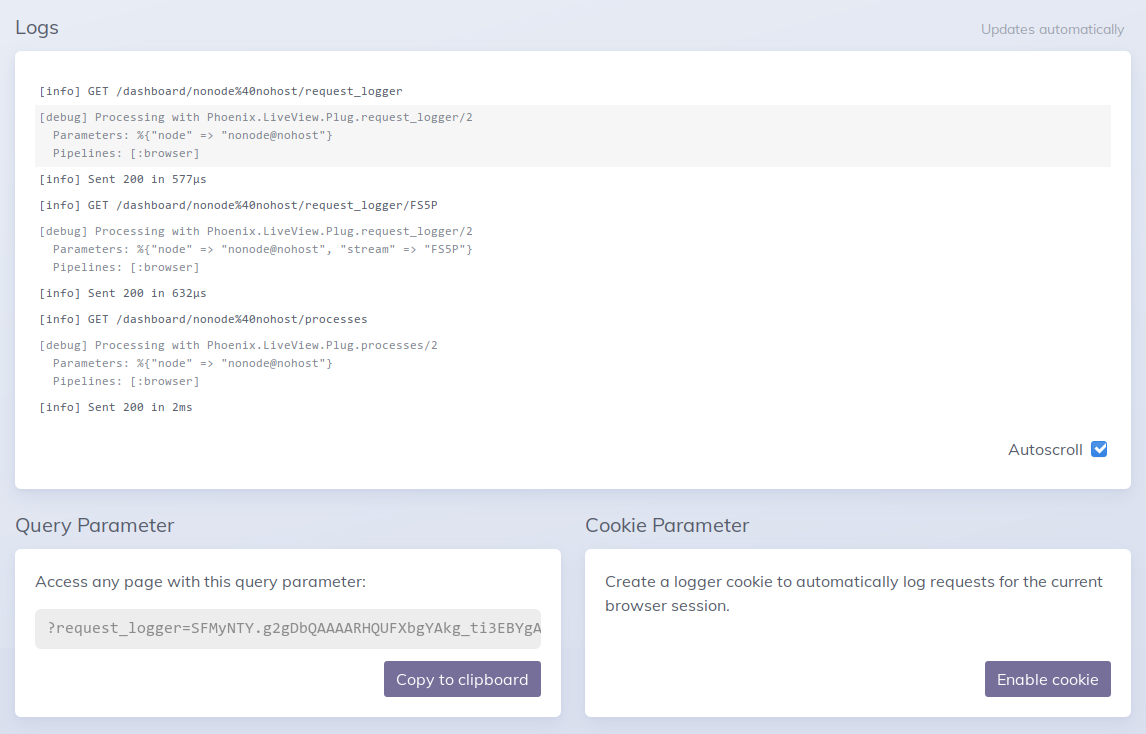
Phoenix 1.5-rc.0 is out and so I fired up a new app to see what’s LiveDashboard is all about. Something that stood up for me is the Request Logger.
Phoenix 1.5
Assuming you have Elixir and Mix available install new Phoenix version as:
$ mix archive.install hex phx_new 1.5.0-rc.0
Note that this command will replace your old phx_new package.
Once installed, let’s create a new app:
$ mix phx.new my_app
$ cd my_app/
$ mix ecto.create
Assuming you have PostgreSQL running and set up with postgres user’s password set to postgres a new database should be created.
To test drive Phoenix 1.5 properly let’s also include the new phx_gen_auth package that contains the new user authentication generators. This will also give us a few pages to walk through for the Request Logger testing.
Add the dependency as any other:
$ vi mix.exs
...
  defp deps do
    ...
    {:phx_gen_auth, "0.1.0-rc.0", only: :dev}
...
And:
$ mix deps.get
$ mix phx.gen.auth Accounts Users user
$ mix deps.get
$ mix ecto.migrate
$ mix phx.server
Once done, we should see a server running at http://localhost:4000/.
Phoenix LiveDashboard
LiveDashboard is the feature of Phoenix 1.5 release. As the name suggests it’s a dashboard built using LiveView.
LiveDashboard can be found at http://localhost:4000/dashboard and it will automatically preselect our localhost node.
LiveDashboard comes packed with various things. It has the following features:
- Home (cpu, memory, io breakdown)
- Metrics (think telemetry)
- Request Logger (web version of console logs on steroids)
- Processes (kind of web version of
:observer)
You can read more about those and more on Elixir 1.5 in the announcement.
All of those are great things, but what I love is the streaming Request Logger.
Request Logger
If we navigate to the Request Logger in the main tab navigation of Phoenix LiveDashboard we will be greeted by three different cards.
The first one is the Logs. Here will our logs appear.
The second is the Query Parameter which gives us a ?request_logger= parameter that we can just include in the page request to see the logs of that particular request. If you are thinking that you can just look at console logs think again. This enables you to debug a request on a running system (with possible log noise) and you don’t even have to be the person invoking the request.

I think that’s fantastic. Even though most of us are gathering logs somewhere finding a particular request is always annoying. Many scenarios now might even go without a logging service at all.
But that’s not all.
If you are debugging your requests, there is a third card called Cookie Parameter that gives you a magic button to Enable cookie for debugging. Once enabled all your requests (all from the browser you are using at the time) automatically show in the Logs on the page.
Just open a new tab and try the new Phoenix sign up and login workflows. Watch the Logs card populate with your logs.
Even if you are debugging a running system with a lot of noise, you will always know what’s happening with your particular requests. Do I have to write more? I don’t think so. Go on and upgrade your Phoenix apps!

